Streaky Hit/Out Data?
In Chapter 10 of our Analyzing Baseball Data with R book, we explore streaky performances of hitters. We start with the observed hit (1) or out (0) for each of the at-bats (AB) for a particular hitter and season. To explore the behavior of a hitter over short time intervals, we construct a moving average plot. For example, here is a moving average plot for the 2023 Alex Bregman using a window of 20 AB.
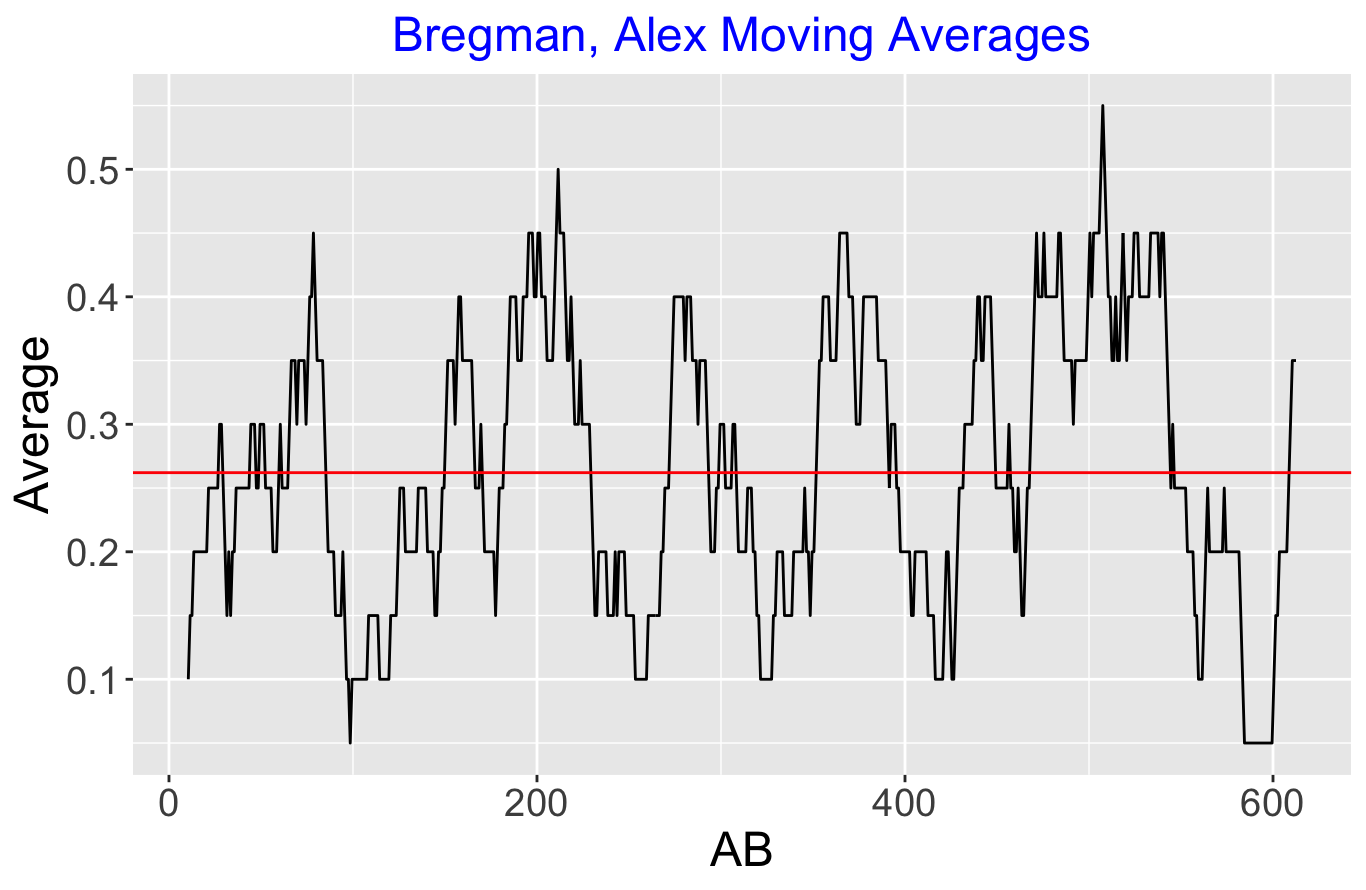
From this plot, one can identify particular periods during the 2023 season when Bregman was unusually hot or cold. But are these patterns of hot and cold performance meaningful? That is, one might observe these periods of extreme highs and lows even if Bergman was a truly consistent hitter, that is, his chance of getting a hit on a single AB is a constant value throughout the season.
To determine if these patterns are meaningful, we perform a simulation experiment as follows.
- We randomly permute Bregman’s sequence of observed outs and hits during this season.
- We construct a moving average plot of this simulated data and compute some value which measures the volatility of the averages — here we use the standard deviation of the moving averages.
- We repeat this simulation many times, collecting the standard deviations.
- We compute a p-value which is the probability that the “random” standard deviation exceeds the observed standard deviation of the moving averages.
In this case, we compute p-value is 0.14. That says, that there is some evidence (since this is a small p-value) that Bregman is truly streaky in his hit/out sequence during the 2023 season. It is somewhat unusual that a random sequence of hit/out data would be as streaky as we observed for Bregman in this season.
Other Measures of Performance
Honestly, this particular approach for exploring streakiness has not led to exciting results. The media loves to talk about streaky performances of performances — the underlying belief is that streaky ability exists among particular players. But this particular statistical approach doesn’t identify truly streaky hitters. There is little evidence that streaky or consistent performances for one season will be predictive of streaky/consistent performances for future seasons.
But perhaps we’re choosing a bad measure of hitting performance. A batting average is a pretty poor measure of hitting performance and so perhaps we might get more interesting results from our streak study if we chose an alternative hitting measure.
A modern alternative measure from Statcast data is the expected BA. From the launch angle and exit velocity, one can compute the probability of a hit, and by summing these probabilities over all balls in play, one can compute an expected number of hits and an expected BA. (By the way, this hit probability is the variable estimated_ba_using_speedangle in the Statcast dataset.)
In this post, we’ll explore the use of the sequence of hit probabilities in a streakiness study. For all players in the 2023 season, we’ll explore the patterns in both the sequences of hits and sequences of hit probabilities and see if there is any association between the streakiness in the two sequences.
The 2023 Alex Bregman
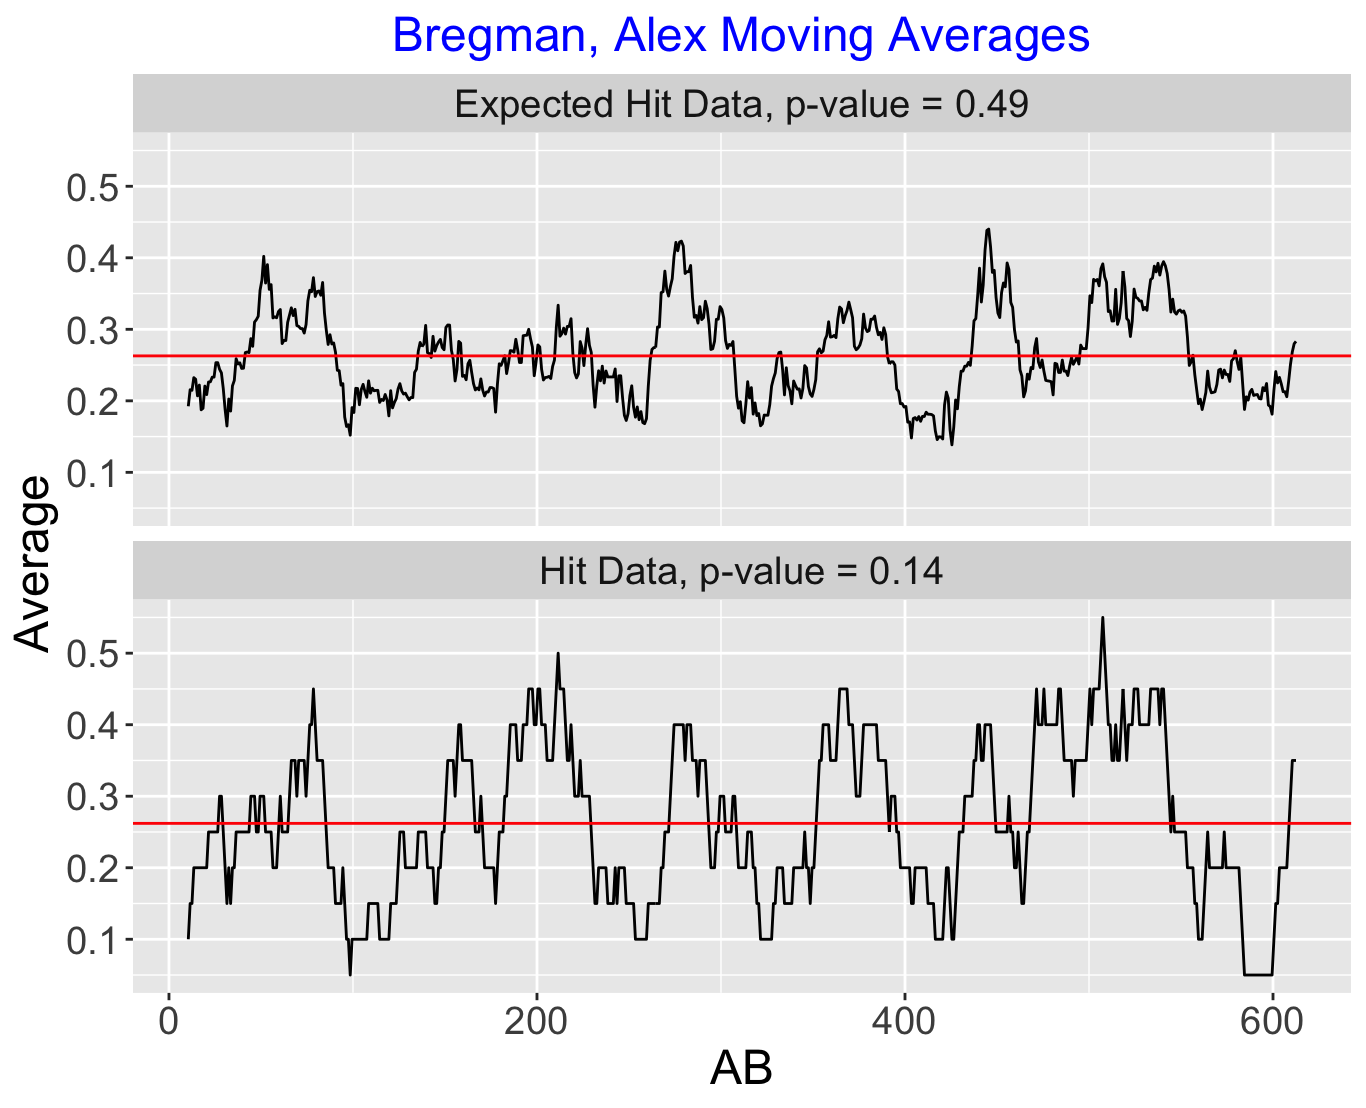
We saw earlier that there was some evidence of unusual streakiness in the Alex Bregman hit/out data. How does this compare with the short time patterns in his hit probabilities? (For each ball in play, we use the hit probability — if there is a strikeout, we use a hit probability equal to 0.). Here’s a comparative graph of the moving averages of the hit data and the expected hit data:
Some observations:
- The moving average plot of the expected hit data tends to be smoother than the moving averages of the hit data — this is expected since the hit probabilities are more continuous.
- We see less volatility in the moving averages of the expected hits. That is, we see fewer extreme highs and lows in the moving averages of the expected hits than in the observed hits.
- More interestingly, when we did our simulation to assess true streakiness in Bregman’s expected hits, the p-value was 0.49. That is, the observed standard deviation of the observed moving averages are close to what you would expect from a random arrangement of the data.
Looking at All Players
I collected all players who had at least 300 balls-in-play for the 2023 season — there were 169 hitters in this group. For each player, using a window of 20 at-bats, I …
- Explored the moving averages of Hits. Used the simulated data method to compute a p-value — the probability the standard deviation of the moving averages of a random permutation of the sequence exceeds the observed standard deviation.
- Explored the moving averages of Hit Probabilities. Use the same method to compute a p-value which measures the extent that the observed moving average is unusual relative to random sequences.
The correlation between the Hit and Expected Hits p-values was only 0.33. That means that streaky sequences of hits (as measured by our metric) are not strongly associated with streaky sequences of hit probabilities. I could show you a scatterplot of the values — this graph (not shown) emphasizes the relatively weak association between the two measures of streakiness.
Reflection
The basic takeaway is that streakiness patterns in hits can be different from streakiness patterns in hit probabilities. I haven’t had much time to reflect on the take-way of this work, but here are some comments that should invite future research on this topic.
- (Choose the right metric) In my research, I have explored many types of streaky data of individuals and teams. One thing I learned is that it may be easier to detect true streakiness by choosing the “right” measure of performance. For example, one might see different patterns of streakiness if one looked at indicators of home runs or strikeouts instead of hits.
- (Does the team care?) From a team’s perspective, I think it is better to focus on a player’s hit probabilities instead of hits. There is a luck component implicit in hits. The baseball fan observes luck in play when she sees a “seeing-eye” ground ball through the infield or a 105 mph liner hit directly to the second baseman.
- (Outcomes of poor contact.) If a batter is going through a hitting slump where he is not making good contact, I would think that the slump is better reflected through the hit probabilities which reflect the launch variables.
- (Reporting streaks.) Maybe the media would get less excited about hitting streaks and slumps if they focused on the hit probabilities rather than the observed hits and outs. Would you think the media would get excited that he or she just flipped 10 coins and got all heads? Of course not since the sportscaster knows the coin is fair. Similarly, he or she should not get excited about streaks that are luck-driven.
