New Book and Home Run Hitting
New Book
My new book Visualizing Baseball is now available.

This book is part of the new CRC/ASA series on statistical literacy. The idea of the book is to communicate interesting patterns in baseballs through graphs. If you like the kind of stuff I write about on this blog, then you may be interested in the book. I also wanted to encourage readers to reproduce the ggplot2 graphs and maybe think of new ways of visualizing this data. So I have an accompanying book website which presents the R code and accompanying data to construct many of the plots in the book. If you look at the Markdown files, you’ll get a glimpse of the topics in the book.
Surge in Home Run Hitting
One of the big stories in the 2017 season is the increase in home run hitting. Several interesting subplots are
- Giancarlo Stanton hit his 50th home run Sunday and he has a reasonable chance of eclipsing Roger Maris’ 61 home runs hit in the 1961 season.
- Rhys Hoskins set a new home run record by hitting 9 home runs in his first 16 games — he currently has 11 home runs in 64 AB for a lifetime HR rate of 17 percent. (This likely will be one of the few highlights of the 2017 Phillies season.)
The Washington Post had a good article about this increase in home run hitting in a June article and this NBC article gives a reference to a sabermetrics study showing how this is likely due to the change in ball construction.
Looking at the Change in Home Run Hitting
One of the chapters of Visualizing Baseball is devoted to batted ball data. I explore the ballpark effect, the relationship between bat speed and distance, and the direction of home runs using Statcast data collected from the ESPN Home Run Tracker. Since I had home run data available for the 2012 through 2016 seasons, I decided to focus in this post on how home run stats have changed from 2012 through 2017.
We know there are more home runs hit this season, but how have home run distances changed from 2012 through 2017? Here I graph parallel boxplots of the distances for the six seasons. The distributions of home run distances are pretty similar, but I notice a subtle shift in the home run distances in recent seasons.

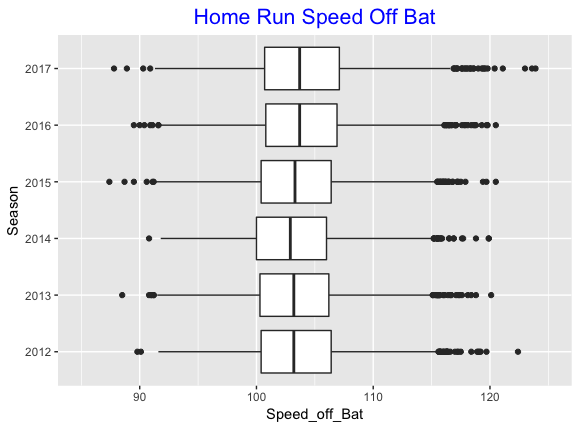
Similarly, if one looks at the speed off the bats for these home runs, we also see a small change in the home run bat velocity over seasons.

To make this change easier to see, I computed the median speed off the bat, and the median distance for home runs for each season and graph the medians below. (I compute the median instead of the mean to remove any effects of the obvious outliers in the data.) The interesting take away from these graphs is that both the median speed and the median distance has shown a steady increase from the 2014 through the 2017 seasons.

Of course, we know that there are substantial ballpark effects for home runs, so I thought it would be interesting to see if this 2014 to 2017 increase was consistent across ballparks. For each ballpark, I focused (for both the home run speed and the home run distance) on the percentage increase from the 2014 to 2017, that is PCT INCREASE = 100 * (2017 Value – 2014 Value) / 2014 Value. It is interesting that this both the median home run speed off bat and the median home run distance have showed an increase between 2014 to 2017. On average, the median distance of home runs has increased between 1 to 3 percent for most ballparks.


Final Comments
It is clear that the increase in home run hitting during the 2017 season is a big deal and it will likely change how players play the game. For example, there is an interesting article at fivethirtyeight.com in the increase in the number of “Adam Dunns” — the players who have a high number of home runs, strikeouts, and walks. Players are hitting balls with higher-elevation angles, hoping to hit home runs. Teams may discard small-ball scoring run strategies, focusing on hitting home runs to score runs. It will be interesting to see how the game reacts to the change in home run hitting in the 2018 season.
Recent Comments