Tribute to 2018 HOF Inductees
Taking a break from our Statcast explorations, it seems timely to pay tribute to the players who were inducted in the MLB Hall of Fame last week. We’ll focus on the three non-pitcher HOF inductees Chipper Jones, Vladimir Guerrero, and Jim Thome.
Jim Thome
Of course Thome is best known for his time with the Indians, but I also remember him as a popular player for the Phillies. Thome was well-known for his home run ability, but he also exhibited a good sense of the strike zone, receiving many walks.
To illustrate Thome’s batting performance through his career, I thought I’d focus on four measures: (1) home run rate per batted ball (HR / (AB – SO)), (2) strikeout rate per PA (SO / PA), (3) walk rate per PA (BB / PA), and (4) wOBA (weighted on-base percentage) as defined by FanGraphs. In each graph, I use boxplots to display the collection of measures for all players with at least 300 at-bats, and display Thome’s values by red dots.
What do we see? Thome clearly had many seasons (between 1996 and 2007) where his home run rate exceeded 10 percent. His strikeout rates were also high for most of his career. His plate discipline is evident when one looks at his walk rates — this rate was between 18 – 20% for many seasons. Summarizing his offensive performance, most of his wOBA values were between 0.400 and 0.450 — these measures did drop off during the last five seasons of his career.

Chipper Jones
Of course, Chipper Jones was a bit remarkable for having a long career for a single team, the Atlanta Braves. Looking at the graphs, we see that
- Jones had good home run power between 1998 and 2007, but not as exceptional as Thome.
- Unlike Thome, Jones was about at the lower quartile with respect to strikeouts — this indicates that he had a good ability to make contact with the pitch.
- Like Thome, he showed good plate discipline with high walk rates.
- His wOBA values were outstanding from 1999 through 2008 — we should ignore the 0.7 value in 1993 when Jones had only 4 plate appearances.

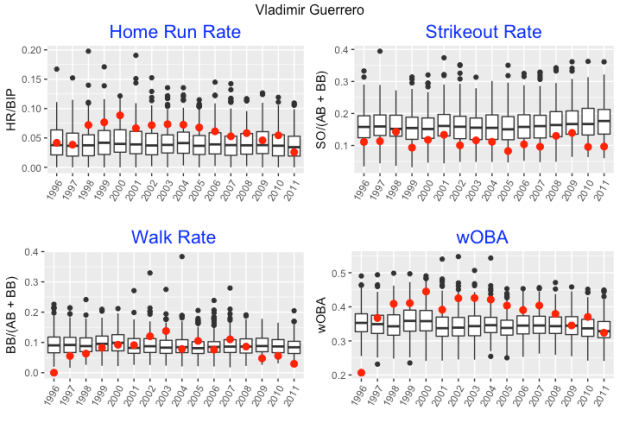
Vladimir Guerrero
Guerrero may not have been as well-known as Thome and Jones, as he spent many seasons with the Montreal Expos. His home run rates over his career resemble those of Jones, the two players also were similar in they were hard to strike out. Guerrero’s walk rates can be described as average, but his wOBA values in the middle of his career were exceptional — I suspect that Guerrero was a line-drive hitter with high rates of singles and doubles.
Edgar Martinez
Although Edgar Martinez was not elected to the HOF, he came close to being elected with 70.4% of the votes (one needs 75% for election) — I think it is likely Martinez will be elected in the 2019 ballot. One possible reason why Martinez was not elected was his designated hitter status, but there is no doubt that he was a great hitter. Looking at this graph, we see that Martinez had good power (especially between 1995 and 2003), low rates of strikeouts, high walk rates, and very high wOBA values.

Under the Hood
I wrote a single function plot_rates() that produces these four graphs for any player of interest. One can see the function on my github gist site. The function uses the Lahman package to obtain the data and the wOBA weights are taken from the FanGraphs site using the baseballr package.
The following R script sources this function and produces these graphs. (The function plot_rates() requires the installation of the Lahman, baseballr, tidyverse, and gridExtra packages.)
library(devtools)
source_gist("b8370d728db5ca6607223f8b32ebc790",
            filename = "plot_rates.R")
plot_rates("Jim Thome")
plot_rates("Chipper Jones")
plot_rates("Vladimir Guerrero")
plot_rates("Edgar Martinez")

Recent Comments