The Vanishing 300 Batting Average
Introduction
When one thinks of a great offensive hitter, several measures come to mind such as the count of home runs, on-base percentage, or a batting average. For example, the number 61 will always be associated with Roger Maris’s HR total in the 1961 season, and .406 is associated with Ted Williams’ AVG in 1941. We likely won’t see a .400 AVG again, but the .300 AVG is still valued by modern players. Given the current decline in baseball hitting, that raises several questions. How common is a .300 AVG hitter? Specifically, how has the number of .300 hitters changed in the last 50 years of baseball? After we address this issue, we’ll look more carefully at the distribution of all qualifying AVGs of hitters for the last 50 years. (Spoiler alert: there are some interesting deviations from a normal curve.) By the way, 1969 seemed to be a good starting point for my investigation, since 1968 was the “year of the pitcher” when the AL batting crown was won by Carl Yastrzemski with a mere .301 AVG.
As you probably know, I make a big distinction between batting ability and batting performance. A player may get 30 out of 100 AB so his batting performance is AVG = 30 / 100 = .300. But that doesn’t mean that the player’s batting ability, that is, his chance of getting a hit in a single AB is .300 or higher. (In fact, I’d doubt this player really is a .300 ability hitter since his .300 performance is based on only 100 AB.) In the last part of this post, I’ll use a random effects model to estimate the hitting probabilities of all qualifying batters in a season. By using these batting ability estimates we can explore the number of true .300 hitters in the MLB in the past 50 seasons.
Number of Qualifying 300 Hitters
First, using the Lahman database, we find the number of .300 hitters in each season. We restrict attention to qualifying hitters who have at least 3.1 *G plate appearances where G is the number of games played in a season (this is usually 162 with the exception of several strike-shortened seasons). Here’s a plot of the number of .300 hitters. This number ranged between 15 and 30 from 1969 through 1990, and the number dramatically increased to 40-50 in the years 1990 through 2000. Since the 2000 season, the number of .300 hitters has been in free fall mode — there were 14 of these hitters in the 2018 season.

Exploring all Qualifying AVGs
After constructing this graph, I was interested in looking more carefully at all qualifying AVGs for the past 50 seasons. I rounded each AVG to three decimal places and I’ve plotted the count of each possible AVG below.

Since the shape looks pretty symmetric, it motivates fitting this distribution with a normal curve. I’ve added a normal curve with mean 0.278 and standard deviation 0.027 to the plot.

Deviations from Normality
How do these AVGs differ from normality? It is hard to tell from the above graph. But for each AVG value, I can compute the Pearson residual defined by
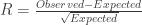
If the normal model is suitable, one expects these residuals to fall between -2 and 2. A graph of the residuals is shown below.

Several interesting things to observe:
- The number of .299 batting averages is unusually low and the number of .300 AVGs is unusually high (relative to the normal curve fit). This shows the importance of a .300 AVG. I suspect that players may get bonuses by getting a season .300+ AVG and the manager may bench a player on the last day of a season so he can keep his .300 AVG. Whatever the reason, a .300 AVG appears to have a special meaning.
- Another thing we notice is that the normal curve does a poor job in predicting low AVGs (like Chris Davis’ recent .168 AVG) and high AVGs (like Mookie Betts’ .346 and the other high AVGs in this period). Really the normal curve is not suitable for batting averages — the distribution of observed AVGs tends to have flatter tails than the normal.
Estimating the Number of True 300 Hitters
As I mentioned earlier, I am interested not in the number of .300 hitters, but in the number of hitters whose batting probability exceeds .300. To find this number, I need to fit a model to season hitting data to estimate the hitting probabilities for all players. Here is one common statistical model for accomplishing this: first one assumes that the number of hits 


I am going to make one adjustment to this random effects model. I am going to assume the logit probabilities are distributed from a Cauchy density (instead of a normal) with unknown location and scale parameters. This adjustment will impact the hitting probability estimates, especially for outlying AVGs. (We saw above that batting averages tend not to be normally distributed. Likewise, I don’t believe hitting probabilities are normally distributed and the Cauchy density allows for more flexible distributions of hitting probabilities.)
I am not going to describe the JAGS fitting procedure here. But below I graph the observed AVGs against the probability estimates for all 2018 players. For players with AVGs close to the middle of the distribution, the estimates will shrink or adjust the observed H / AB towards the middle AVG. But for extreme AVG players like Chris Davis and Mookie Betts, the degree of shrinkage is much less. Basically, we are treating these outliers differently — we see these .168 and .346 AVGS as special and we only perform modest shrinkage towards the mean.

In the above graph, I label with red the points corresponding to players with estimated hitting probabilities greater than .300. In the 2018 season, we had 14 players with observed AVG exceeding .300 but we only estimate that 3 of them had true AVGs exceeding .300.
I repeat this fitting procedure for each of 50 seasons and graph the number of true 300 hitters (that is, the number of players with .300+ estimated hitting probabilities). In the early seasons, the number of true 300 hitters was on average 5, it climbed to 15-25 in the 1995 – 2000 seasons, and is on a downward trend in recent seasons. I would not be surprised if this number approaches zero in a few seasons.

Closing Comments
Here are some general takeaways or themes in this discussion.
- What is a .300 batting average? This post has shown that a meaning of .300 batting average really has changed through the history of baseball. In the 2000 season, a .300 AVG was relatively common and currently it is pretty rare. Will the .300 AVG disappear?
- Baseball heros. To remain a popular sport, baseball needs its heros, and these heros are defined by statistics such as HR, AVG, ERA, etc. If our benchmarks for excellence such as a .300 AVG are not reachable, then will it be harder to recognize a great hitter? I know that a batting average is a relatively weak measure of hitting performance, but it still will be used to measure hitters for many seasons to come.
- Distribution of baseball talent. One side question of interest is “how is baseball talent distributed?” I believe that batting averages tend to be roughly symmetric, but there are interesting deviations from normality especially at the high end. Perhaps one can define a Hall of Famer as a player that truly stands out using some meaningful measure of performance.
- Random effects models. Although we observe baseball performance such as 100 hits in 300 AB for a .333 AVG, we are most interested in a player’s ability such as a hitting probability since his talent is most predictive of future performance. These random effects models like the ones illustrated above are a good way of estimating talent.

Recent Comments