Using Markov Chains to Predict Pitches
In a recent post by Jim, he went over how to use Markov chains to look at pitch count sequences. In this post, I will look at how Markov chains can be used to help determine the probability of a specific type of pitch being thrown given the pitch type of the previous pitch. States will restart after each batter, meaning that the last pitch to each batter will not be used to predict the first pitch of the next batter. Additionally, all data used is from the 2015 season and comes from MLB Gameday. Since most of the code for scraping data has already been explained in various posts by Carson Sievert, I will show my code, but focus more on how to produce Markov chains.
library(pitchRx)
library(RSQLite)
library(dplyr)
library(msm)
library(xtable)
library(data.table)

db2015_All <- src_sqlite("MLB2015_All.sqlite3", create = TRUE)
scrape(start = "2015-04-05", end = "2015-10-09", connect = db2015_All$con)
db2015_All <- src_sqlite("MLB2015_All.sqlite3", create = FALSE)

# Join the location and names table into a new que table.
locations <- select(tbl(db2015_All, "pitch"),
pitch_type, px, pz, des, num, gameday_link, inning)
names <- select(tbl(db2015_All, "atbat"), pitcher_name, batter_name,
num, b_height, gameday_link, event, stand)
que <- inner_join(locations, filter(names, pitcher_name == "Chris Sale"),
by = c("num", "gameday_link"))
pitchfx <- as.data.frame(collect(que))
pitchfx <- data.table(pitchfx[ do.call(order, pitchfx[ , c("gameday_link","inning", "num") ] ), ])
pitchfx[, batter_num:=as.numeric(factor(num)), by=gameday_link]
pitchfx <- as.data.frame(pitchfx)
pitchfx$batter_num <- ifelse(pitchfx$batter_num %% 9 == 0, 9, (pitchfx$batter_num %% 9))
pitchfx$batter_num <- as.factor(pitchfx$batter_num)
pitchfx$pitch_type <- as.factor(pitchfx$pitch_type)

# Create a new field for the batting order number.
pitchfx$batter_num <- ifelse(pitchfx$batter_num %% 9 == 0, 9, (pitchfx$batter_num %% 9))
pitchfx$batter_num <- as.factor(pitchfx$batter_num)

# FF, FA, and FS are so small and possibly misclassified. Change them to FT.
pitchfx$pitch_type[pitchfx$pitch_type == 'FF'] <- 'FT'
pitchfx$pitch_type[pitchfx$pitch_type == 'FA'] <- 'FT'
pitchfx$pitch_type[pitchfx$pitch_type == 'FS'] <- 'FT'
pitchfx$pitch_type <- droplevels(pitchfx$pitch_type) # drop levels FF, FA, FS

pitchfx$pitch_type_full <- factor(pitchfx$pitch_type,
levels=c("FT", "CH", "SL"),
labels=c("2-seam FB", "Changeup", "Slider"))
pitcher <- as.data.frame(pitchfx[c(1,5:9, 13:14)])
pitcher$uniqueID <- paste(pitcher$num, pitcher$gameday_link, pitcher$inning, sep='')
')
Chris Sale
After collecting my MLBAM data, I will create a unique identifier for each batter, gameID and inning. The final data that I will be working off of for a specific pitcher will look like the data frame below.

There are a few different Markov chain packages in R, but one specifically designed for multi-state Markov models is the msm package. This will allow me to restart after each state (unique identifier), which is unique to each at-bat that Chris Sale pitches to. Therefore, when Sale faces Daniel Santana in his second at-bat on the 04/12 game, it will be treated as a new state.
I’ll start off by looking at the overall pitch proportions for Sale in order to determine whether or not the Markov chain gives us an advantage. The first thing that stands out is that Sale throws a fastball more than half of the time.
pitcher.table <- table(pitcher$pitch_type_full)
prop <- prop.table(pitcher.table)
print(round(prop,3))

In just two lines of code, the msm package allows me to print out Sale’s pitch type transition matrix, which will be both the number of instances that fall into each state, as well as the percentages.
pitcher.matrix <- statetable.msm(pitch_type_full, uniqueID, data=pitcher)
transition.matrix <- round(t(t(pitcher.matrix) / rep(rowSums(pitcher.matrix), each=ncol(pitcher.matrix))),3)
transition.matrix
pitcher.matrix


What this tells us is that even though a two-seam fastball is Sale’s most thrown
pitch, when he threw a changeup on the previous pitch, he is 10-12% more likely to
come back with another changeup than if he had previous thrown a fastball or slider.
Additionally, if he threw a two-seam fastball on the previous pitch, then we can confirm that there is a greater than a 50% probability that he’ll come back with the same pitch. This type of information shows the importance of Markov chains because it is simply
missed when only looking at overall pitch proportions.
The first pitch of the at-bat is not being captured because there is no previous pitch, so we can also look at the pitch proportions for only the first pitch with the following lines of code.
first.pitch <- pitcher %>%
group_by(num, gameday_link) %>%
filter(row_number() <= 1)

first.pitch.table <- table(first.pitch$pitch_type_full)
prop.first.pitch <- prop.table(first.pitch.table)
print(round(prop.first.pitch,4))

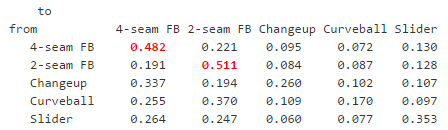
Joe Kelly
Finally, I’ll take a look at one more example in which Markov chains give more insight into
Red Sox pitcher, Joe Kelly. Using similar code as above, we can see Kelly’s pitch proportions in the table below.

In this case, when Kelly threw a four-seam fastball on the previous pitch, we now know that there is a 48% chance he’ll throw a four-seam fastball on the next pitch. A significant jump from the 32% overall probability of a four-seam fastball. Additionally, when Kelly threw a two-seam fastball on the previous pitch, we now know that he is most likely to come back with that pitch again. The batter may have already been expecting a fastball from Kelly, but now we have a better idea if it will be a four-seam or two-seam fastball.
pitcher.matrix <- statetable.msm(pitch_type_full, uniqueID, data=pitcher)
transition.matrix <- round(t(t(pitcher.matrix) / rep(rowSums(pitcher.matrix), each=ncol(pitcher.matrix))),3)
transition.matrix
Summary
Although I did not test for statistical significance, I felt that a full season worth of pitches for each pitcher would give a fair representation for demonstration purposes. Overall, Markov chains are easy to use in R thanks to packages like msm and markovchain. A potential further analysis can be done to enhance the accuracy of the Markov model by not only using pitch type, but the pitch location too. An example of this would be that if Sale threw a fastball in the bottom third of the zone on the previous pitch, then he is going to come back with a high fastball x% of the time on the next pitch.
Further analysis and all code can be seen on my GitHub page.

Recent Comments