My Top 10 Baseball Graphs of 2017
Introduction
Since 2017 is ending soon, it seemed to be a good time to reflect on my weekly posts and display some of the interesting graphs (my top ten) that I have constructed this past year. What are my criteria for including these graphs? I favor graphs that are pretty self-explanatory (you don’t have to stare at the graph for a long time to figure out the message), and help to remind me of some of the notable events in the 2017 MLB season. If one wrote a summary paragraph of the 2017 season, I would think “Statcast”, “home runs”, “team streaks” might be words that would be included and my posts reflect those topics.
Type of Batted Balls Described by Launch Angle and Exit Velocity

From a data perspective, the big news in 2017 is the availability of the new Statcast data through Baseball Savant. In this post, I show how one can think of types of batted balls (fly balls, ground balls, line drives, and popups) in terms of locations in the (launch angle, exit velocity space). Certainly “launch angle” is an important word in the vocabulary of a 2017 MLB hitter.
Chance of a Hit Depends on Launch Angle and Exit Velocity

Continuing on the Statcast data theme, here I describe how one can use a generalized additive model to predict the probability of a hit based on knowing the launch angle and exit velocity. As we see, the launch angle of the batted ball is very relevant unless one hits the ball very hard in the air.
Notable Streaks and Slumps

There were some notable winning streaks in the 2017 season by the Indians and the Dodgers. In this post, I use various graphical methods to visualize the interesting Dodgers streakiness — they were very hot for much of the season but had a dramatic losing tendency at the end.
Ryan Howard Platoon Performance

I have to mention at least one player from the Phillies — my home team when I was growing up. In this tribute to Ryan Howard, I explore his hitting performance over his career against lefties and righties — he ended his career as a platoon hitter, hitting only against right-handers.
Shrinkage of Hitting Rates

An interesting statistical problem is to predict the final batting average of a player given his performance at some point during the season. In this post, I illustrate one of my methods of decomposing a batting average into three different rates (SO rate, HR rate, and BA rate) and applying shrinkage methods to each set of rates for all players. Looking at the graph, it seems that my predictions of final season AVG for Posey, Turner, and Zimmerman were all in the .290 – .310 range — looking at Baseball Reference, I see their actual 2017 AVGs were roughly in this range.
Home Run Distances

One of the big stories in 2017 was the record number of home runs hit. This post explored the distances in home runs using data from the Home Run Tracker. This graph shows that for many ballparks, there was a 1-3 percent increase in the lengths of home runs between 2014 and 2017.
Stanton Home Run Prediction

In 2017, there was a lot of attention to two sluggers, Aaron Judge and Giancarlo Stanton who were hitting many home runs. How many home runs would Stanton eventually hit? In this post, I use a Bayesian multilevel model to predict the chance that he would break Roger Maris’ record. (It turned out that he fell short of the Maris record.) . I wonder how Judge and Stanton will perform (home run wise) in the 2018 season as teammates on the Yankees.
Variation in Home Run Rates

Continuing on the home run theme, one question is what is the reason for the variation in home run rates — is it due to the variation in hitter abilities, or the variation in pitcher’s tendencies to allow home runs? In this recent post, this graph answers the question — there is much more variability in true hitter home run rates than in true pitcher home run rates.
ggplot2 Can Do Word Clouds

In this fun post, I got inspired by looking at another post, to see if the ggplot2 package could be used to construct the popular word clouds. This plot shows how popular first names of ballplayers have changed over baseball eras.
Lengths of 2017 World Series Games
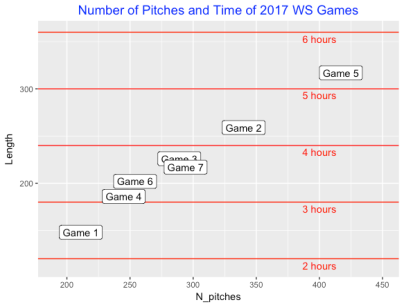
The 2017 World Series was very exciting, even though some of the games were very long. In this World Series post, I show that game lengths are a function of the number of pitches, and there were dramatic differences in the length from the very short Game 1 to the historic over than 5 hours Game 5.
2018
I expect the 2018 season to be exciting — one nice aspect about baseball competition is its unpredictability. Although I am unsure about the frequency of my posts (Sports Illustrated will be only publishing issues every two weeks starting this summer), I will continue to explore topics that will showcase the use of R in addressing questions in baseball.

Recent Comments