Home Runs and Run Production
Introduction
We all know that home run production is up in 2019 (see my recent post for a visualization of this increase). But I’m interested in exploring how this increase in home run hitting has changed run production in baseball.
Let’s first think about a “traditional” view how runs are scored in baseball. I say traditional in the sense that it is the way that I generally thought teams thought about run scoring when I was growing up. A manager sets up a batting lineup so that the the first few batters get on-base (so-called “setting the table”) and then the followup hitters’ roles are to advance those runners home. Moving the runners into scoring position plays an important role in this traditional view of scoring. Sacrifice bunts and stolen bases are used to advance the runners. Speed is an important attribute of a batter in this traditional view — a speedy runner is able to advance an extra base in particular situations. With one out, a runner on 3rd base has a better chance than a runner on 2nd base in getting home.
Contrast this traditional view with the 2019 system for scoring runs in baseball. Home runs currently play a major role in scoring runs. A home run is an automatic run for your team. Sure, it is nice when there are runners on base, but a home run always produces one run. With this modern view of scoring, stealing bases and sacrifice bunts are not a significant part of the run-scoring strategy. Why sacrifice an out with a bunt or a failed stolen base attempt? You are giving your team fewer opportunities to hit home runs.
In this post, I’ll show using several graphs how home run hitting has played an increasing role in run production. Following a discussion of these graphs, I’ll suggest that the changing role of home run hitting impacts other aspects of baseball offense and that will motivate further explorations.
How are Runs Produced?
There have been dramatic changes not only in home run production but in the fraction of runs produced by home run hitting. For each of the seasons from 1960 through 2018, I computed three quantities: (1) the total number of runs scored, (2) the total number of home runs, and (3) the total number of runs produced or batted in by home runs. Let’s consider the percentage
HR_Pct = (Runs produced by home runs) / (Total runs)
Below I graph this HR_Pct against season. What do we see?
- Home runs contributed about 1/3 of the runs scored in 1960 but it dropped steadily to about 25% about 1980.
- But then there was a general increase in home run percentage which slowed down about the 2000 season.
- Since about 2010 there has been a steady increase in home run percentage with an all-time high value about 42% in 2017. (I suspect it may be higher than 42% this season.)

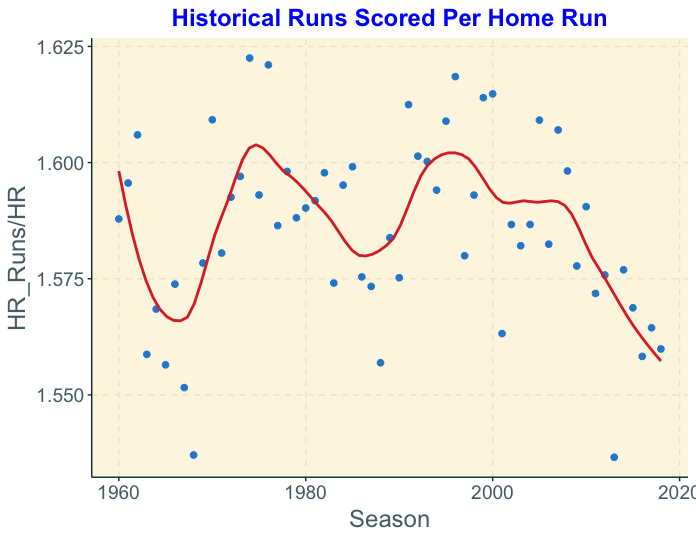
Runs Produced for Each Home Run
It is also relevant to look at the average number of runs produced by a home run and see how that has changed in baseball history. Before I looked at the data, I suspected that the average runs per home run has dropped in recent years. Why? Well, if teams are less interested in getting runners on base, then there would be more solo home runs and this would drop the average run scoring of home runs.
By the way, I should distinguish runs produced per home runs from the runs value of home runs. For example, a grand slam home run will produce 4 runs, but the value of this particular home run will be smaller than 4. The runs value calculation takes in account the run potential before and after the home run and the run potential with bases empty is smaller than the potential with the bases full.
Looking at the graph below …
- The average runs scored per home run hasn’t shown a trend like the home run count but we see some interesting up and down behavior.
- Since the 2000 season, there has been a steady decline in the runs per home run.
- There are some interesting outliers at both the high and low ends which probably deserve further study.
So What?
There are some consequences of the increasing role of home runs in run production.
- Value of players: Jay Bruce or Dee Gordon? Bruce and Gordon, teammates on the Mariners, are very different types of hitters. Dee Gordon is a singles machine and is speedy around the bases. In contrast, Bruce focuses on hitting home runs — his batting average currently is only .188, but 12 of his 24 hits are home runs. Given the important role of home runs in scoring runs, I would think that hitters like Bruce would be more valued than hitters like Gordon.
- View of strikeouts. As we know, the percentage of strikeouts among plate appearances has been steadily increasing. But players with high strikeout rates tend also to hit home runs. So maybe strikeouts will be viewed as one of those consequences of hitting home runs and teams will be more accepting of these strikeouts.
- Fewer defensive plays. With more strikeouts and more home runs, fewer balls will be put in play. Does that mean that defense will play a smaller role in baseball/
- Fewer singles. The perceived value of a single seems to have dropped since they don’t contributed to as many runs as in the past.
All of these suggested consequences can be explored with data. For example, it would be interesting to classify all runs scored by the sequence of plays that lead to the runs scored. For example, three single-base events like “single, walk, single” may lead to a run — how has the frequency of this sequence of plays changed over the last 20 years. How many stolen bases contributed to runs scored? MLB has concerns about this increasing role of home runs in run scoring and it would seem that some additional understanding of the changes how runs are scored would be beneficial.

Recent Comments