In my recent post, I took a historical look at bunts and sacrifices. Here I will focus on the recent 2015 season and explore the use of bunts by players and teams. Specifically, here are some questions to address:
- How many bunts are there in baseball and how does it vary among teams? (Of course, due to the DH, I would expect that most bunts would occur in the National League.)
- There are two basic purposes of a bunt — one is to sacrifice to advance a runner on base, and a second is to get an infield hit. Who are the most-frequent butters and for what purpose?
- I’ll address some “when” questions — what position in the lineup are likely to bunt and what are common base/outs situations?
I’m using the Retrosheet play-by-play data frame for the 2015 season. The runs in the remainder of the inning is available in my data frame so I can compute runs expectancies and probabilities of scoring for each situation.
What Teams are Bunting?
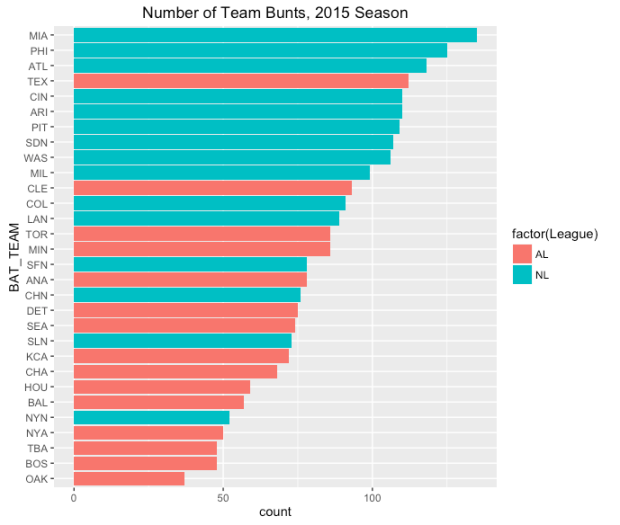
The following graph shows the frequency of bunts for all 30 teams. Since the League is obviously important here, I’ve colored the bars by the league.
A couple of interesting things here. Obviously, there is a lot of variability from Miami (high) to Oakland (low), and the NL teams, as expected, tend to bunt more. But there a couple of teams that seem to buck the trent — Texas is a big bunter in the AL and the Mets are unusually low in the NL.
Batter Lineup Effects
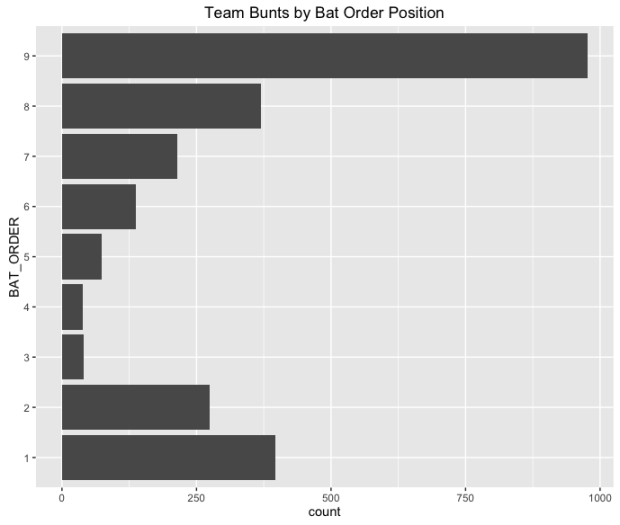
Which batters in the lineup tend to bunt more?
As expected, the 9th hitter (typically the pitcher) tends to bunt, but batters at the top of the lineup (1st and 2nd) and also batters in the bottom of the lineup (7th and 8th). The batters at the top of the lineup are trying to bunt to get on base, while the one at the bottom are weak hitters who are trying to advance a runner.
Bunting Stars?
Who are the current batters who tend to bunt? Here are the top-10 in the 2015 season — each had at least 20 bunts.
   nameFirst    nameLast     N    SH     H Success_Rate
       (chr)       (chr) (int) (int) (int)        (dbl)
1        Dee      Gordon    38     6    16           58
2      Billy    Hamilton    38     9    12           55
3      Erick       Aybar    32     7     9           50
4     Delino   DeShields    29     7    12           66
5      Elvis      Andrus    23     8     9           74
6      Cesar   Hernandez    23     4     7           48
7       Cory Spangenberg    23     8     9           74
8     Freddy      Galvis    22     7     7           64
9    Anthony        Gose    21     2     7           43
10 Francisco      Lindor    20    13     2           75
I’ve added a few columns here. N is the number of bunts, SH is the number of sacrifice hits, and H is the number of hits. I define a Success_Rate to be the percentage of bunts that either are SH or H. Some of these players like Dee Gordon and Billy Hamilton use a bunt to get a hit — their success rates (55 and 58) seem low, but many those bunts are intended for hits. In contrast, other hitters such as Francisco Lindor primarily use a bunt for sacrificing and his success rate is much higher.
When?
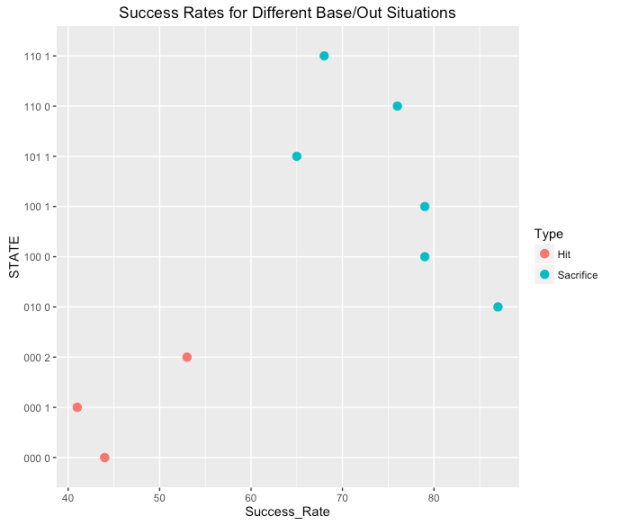
The following dot plot shows the percentage of successful bunts in the popular bases and outs situations. In some situations, it is more common to sacrifice (these dots are blue) and other times, a hit is the desired outcome (dots colored red). This shows that sacrifice bunts typically are successful about 70-80 percent of the time; in contrast, bunt hits have a lower success rate. It is interesting that the most successful situation for sacrificing is a runner on 2nd with no outs.
Should One Bunt?
In Curve Ball, Jay and I spent a chapter discussing strategy in baseball and the decision to try to sacrifice is one of those big decisions. Since the popularity of bunting is waning, it seems worthwhile to revisit some of that discussion. I’ll just provide an overview of our discussion with a view to the upcoming 2016 season.
- One starts with some objective — say we have a close game and the team wants to score at least one run.
- When there is a runner on 1st with less than 2 outs, then the batter has to decide on either bunting and maybe advancing the runner to third, or hitting away.
- The manager should choose the strategy which leads to the larger probability of scoring in the inning. The strategy will depend on (1) the likelihood that the bunt will be a successful sacrifice, and (2) the likelihood of the specific hitter will get a base hit if he decides to swing away. I think the manager can make reasonable guesses at both quantities and these values would lead to an appropriate strategy. In the Curve Ball chapter, we describe how the computations are done. Specifically, it makes sense for weak hitters to bunt to try to advance the runners.
- Baseball is always changing — specifically there are current changes which likely will affect the decision making. First, run scoring is down and strikeouts are up — this would seem to make a bunt a better strategy. Also, teams are much more likely to use full defensive shifts on hitters — this would seem to open up one side of the infield and make it much more attractive to bunt.
All of the R code to create these works can be found on my gisthub site.
I provide the code to download the Retrosheet data for the 2015 data and compute run expectancies if desired, and give the ggplot2 code for producing the graphs.


