In the last post, I did a brief stolen base study using 2016 Retrosheet play-by-play data. This week I downloaded the Retrosheet game logs for the 2016 season. Here I will use this game log data to see what variables are helpful for explaining the variation in game duration.
Can we make a reasonable prediction of the time of the game based on data from a box score?
Useful Predictors?
Looking at the variables in a box score, what variables are predictive of game length? I first looked at a few potential predictors, primarily for curiosity.
Do baseball games get longer as the season progresses? I computed a variable day defined to be the number of days past April 1. Here is a scatterplot of game duration against day with a smoother added.
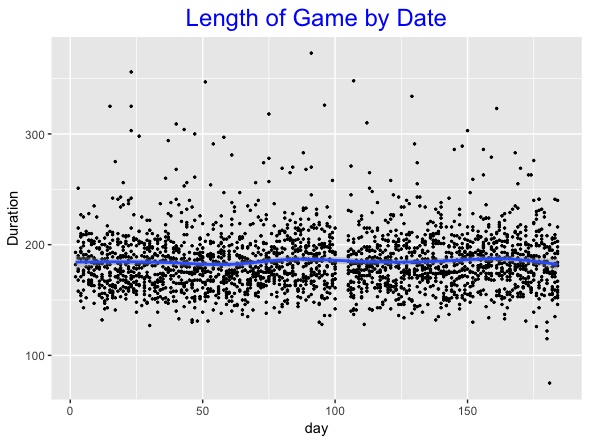
Not much interesting here. We see the All-Star break (the gap from days 100 to 110), but the time of game, on average, is approximately 3 hours (180 minutes) from the beginning to the end of the season. I also noticed a bunch of outliers at the high end — maybe these are extra-inning games?
Does the length of game vary by the day of the week? Here are some parallel boxplots where I’ve ordered the boxplots by the medians.

This is a little interesting — Saturday games tend to be longest, on average, and Wednesday games tend to be shortest. The size of the effects are small, so it is not that exciting a find.
Let’s Get Serious
Okay, most games have around 54 outs, so the number of outs likely is not a useful predictor of game length. But the number of non-outs (hits plus walks plushbp) would seem to be a useful predictor. Below I confirm this by plotting the non-outs and the game duration. (I thought that many of the high outliers were due to extra-inning games. I was right — when I filtered the data to only 9-inning games, theses outliers disappeared in this graph.)

A Simple Regression Model
Clearly NonOuts is a useful predictor of game length. After some exploration, I found that another boxscore variable was helpful in this prediction — the fraction of runners left on base (LOB) divided by the NonOuts, that is LOB / NonOuts. We’ll call this variable LOB_Frac — this is approximately the fraction of runners who remain on base (don’t score). (I say approximately since NonOuts include home runs that won’t have runners.)
When I fit a regression model using NonOuts and LOB_Frac, I get the fit
Game_Duration = 95.77 + 2.71 * NonOuts + 35.32 * LOB_Frac
To understand this fit, I let the LOB_Frac be equal to 0.2, 0.5, 0.8 and plot the predicted Game Duration as a function of NonOuts.

- If the LOB_Frac value is held constant, then for every 10 additional NonOuts, the Game Duration will increase by 27 minutes.
- On the other hand, if we fix NonOuts, then as LOB_Frac goes from 0.2 to 0.8, the Game Duration will increase by 20 minutes.
- The bottom line is that the number of NonOuts and the fraction of NonOuts left on base are both relevant for predicting the time of the game.
What’s Left?
Of course, the fit is only part of the story — I should gain some understanding of the size of the residuals, that is Residual = Duration – Fit. I plot the residuals against the NonOuts below.

Looking at summary(fit), I see the residual standard error is about 13 minutes. This means that about 2/3 of the residuals will be between -13 and +13 minutes, 95% of the residuals between -26 and 26 minutes, etc. There are variables such as the number of pitches, the number of pitchers, the number of challenges, etc. which would explain some of remaining variation in the game duration.
Looking Further
There is much more that could be discovered about Game Duration, but the purpose of this post was to see what I could learn from the Retrosheet game logs. Several years ago, I wrote a post where I collected PitchFX data to explore the time between pitches. Since the time of game is an important issue (maybe the popularity of baseball is waning due to the longer games?), I would think that MLB would want to do an extensive study to learn what variables are relevant for understanding game length.
R Script
As usual, I show all of my R work in the script game_duration_study.R on my Github Gist site. This script gives information on getting the Retrosheet game log data and obtaining a file with the variable name header.

You have probably picked up on the following: 1) You did not carry over into this code the theme “TH” from your previous post, and 2) the plot to illustrate the effect of removing outliers (“fit3” and the “d9” dataframe residuals) appears to be a misplaced cut-and-paste error (from the next plot in the code).
Thanks, as always for sharing your interests and code,
George
George: Thanks — I was a bit sloppy in copying my R work to github. I think it is better now. Jim
Hi Jim,
Thanks for your posts and sharing your code. It’s especially useful for someone just started like me. So I’m curious to see about how extra innings played a role in home team wins. But to my surprise, I didn’t find # of innings played in game log files. Just would like to make sure I’m not missing anything in the file.
So I ended up extracting information from play-by-play data, but encountering error messages when pulling 2014, 2015 data. Have you seen that before?
Btw, overall at a league level, home team only win ~50% of the times when there are extra innings, another surprise. But could be pretty different by team.
– I went to your session in JSM. Very interesting topic!
Thanks!
Meng