 Eagles Win!!!!
Sorry this post is a little late this week, but I’ve been distracted celebrating the Eagles win in the Super Bowl. (When you are a Philly fan, this is one of those “once in a lifetime” sports events.) . I was on route to D.C. during the game but was fortunate to make it to my hotel to see much of the game — remarkably the first play I saw was the trick play for the touchdown at the end of the first half.
Exploring Called Pitches
Getting back to baseball, I am interested in exploring the called pitches. Of course, balls falling within the zone are supposed to be called strikes and balls outside the zone are supposed to be called balls, but if you have watched a game, you know that there are some questionable ball and strike calls. That raises the question — how does the “true” strike zone correspond to the official zone?
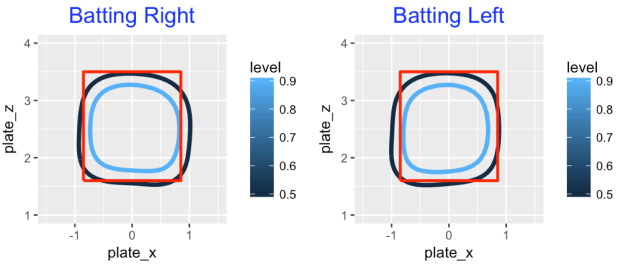
Using my current favorite toy (a generalized additive model), I fit the general model
logit Prob(called pitch is a strike) = s(plate_x, plate_z)
where s() represents a smooth function of the x and z coordinates of the pitch across the plate. I fit this model twice to the 2017 Statcast data — once to the pitches to right-handed batters and again to the pitches to left-handed batters. Below I display the curves with two contour lines where the fitted probability of a strike is 0.5 (black) and 0.9 (blue). We see one obvious bias — umpires tend to call strikes on outside pitches. Also pitches in the upper corners of the zone tend to be called balls.
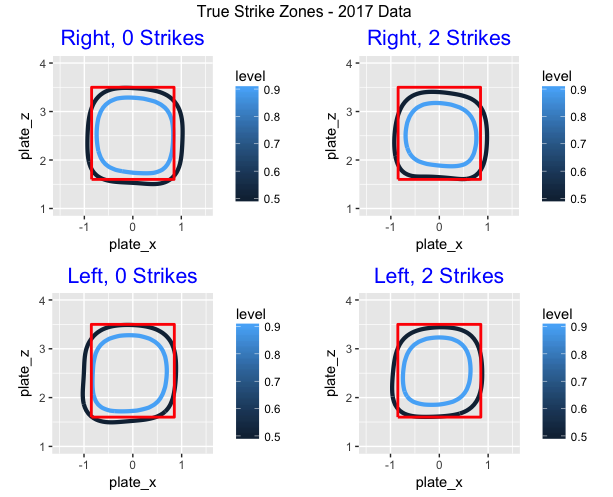
The Count Effect
Does the true zone change as the count progresses from 0 to 2 strikes? I repeat the above fitting for four situations — batter either right or left-handed and the number of strikes in the count is either 0 or 2. We see a slight count effect — the zone tends to shrink for 2 strikes which makes sense.
Umpire Effects
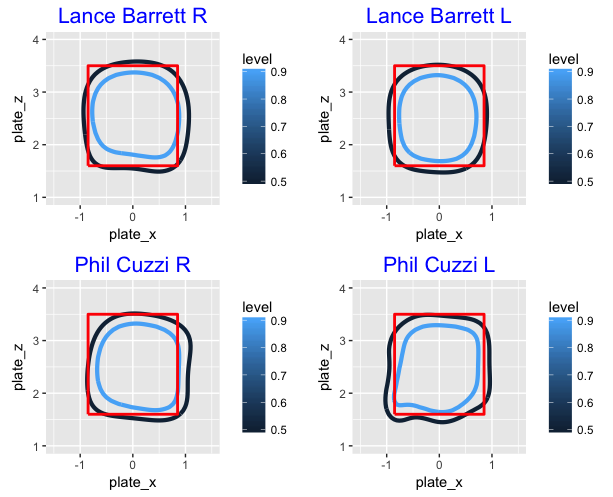
Actually there are many variables that could affect the shape of the true zone including the pitcher, the batter, the catcher and the umpire. (My ABWR coauthor Max is well-known for his studies on catcher framing that measures the ability of the catcher to influence a ball/strike call.) Here I’ll explore the differences between umpires. (Brian Mills was kind to share his umpire dataset for games that I merged with the Statcast data.) Below, I construct a scatterplot of the number of called pitches (horizontal) and the fraction of called strikes (vertical) for all 2017 umpires. I’ve labelled four umpires who appeared to call a high fraction of strikes.

What do the true zones look like for these high strike rate umpires? To answer this question, I fit my gam model to called pitchers for these four extreme umpires. If we focus on Lance Barrett, we see that he tend to call outside pitches strikes, especially for right-handed batters. Phil Cuzzi tends to call pitches down and outside strikes to left-handed hitters — a left-handed pitcher with a good slider would like this particular umpire.
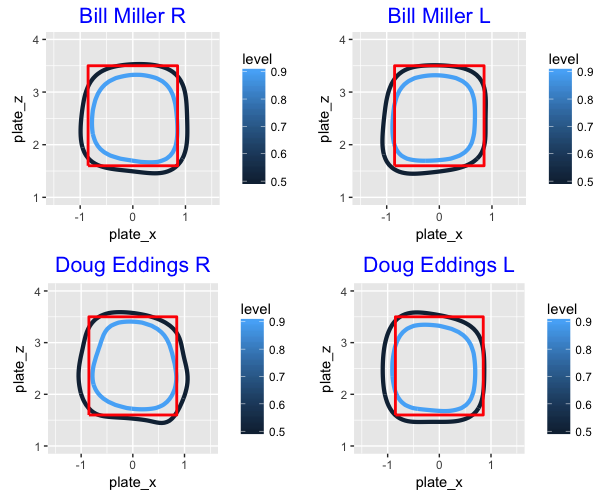
Both Bill Miller and Doug Eddings tend to call both outside and inside pitches strikes to right-handed hitters.
Moving Forward …
This post represents a first look at called balls and strikes. The generalized additive fit seems to be a useful way to explore sizes of zone regions in different situations. I’d be interested next in measuring the sizes of the umpire effects. One promising approach is to apply multilevel models where each umpire is represented by a “random effect”. These umpire effects are not estimated in isolation, but they should be properly adjusted for other relevant variables such as the batter, pitcher, and catcher. Although I haven’t looked at Max’s work carefully, I believe he used this general approach for measuring catcher framing.
R Code …
You can find the complete R script for this blog work in my Github gist site. Some comments:
- I obtained the Statcast data by using Bill Petti’s baseballr package and Brian Mills gave me the umpire data.
- I use two functions — one to implement the gam fitting and a second to construct the contour plot.
- Since I wanted to make sure the zone graphs were drawn at reasonable scales, I used the coord_fixed function with scale = 1. This preserves the aspect ratio at one which is useful when you are presenting a number of these graphs.
Added later …
Aaron asked what code I used to extract the Statcast data — here is the R script.
